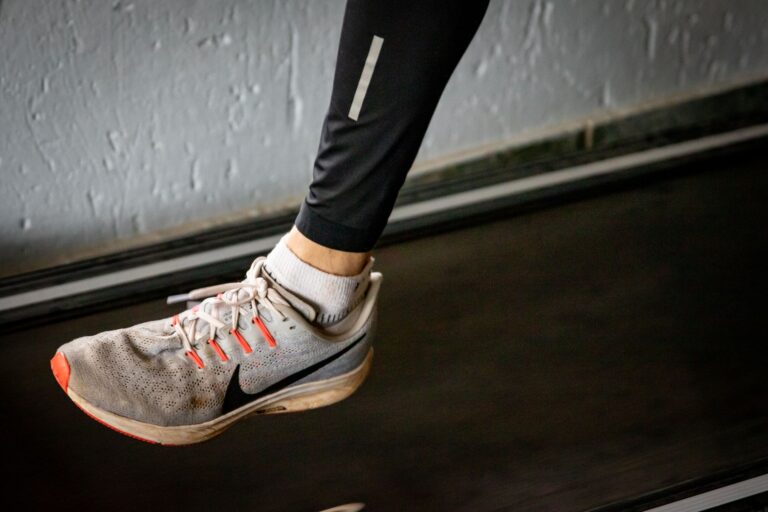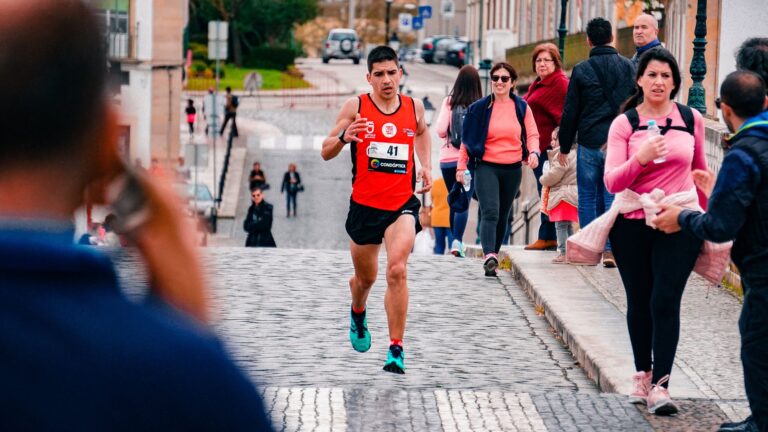
Exercise metrics are standardized measurements that quantify your physical performance, allowing you to track progress and understand your fitness level with concrete data rather than subjective feel. The most commonly tracked metrics include heart rate, pace, distance, calories burned, and recovery time—each providing different insights into how your body responds to training. For example, a runner might notice that their average pace is 9 minutes per mile with a heart rate of 160 beats per minute on a training run, but the same pace might only elevate their heart rate to 145 beats per minute six months later, indicating improved cardiovascular efficiency even though the pace hasn’t changed.
Understanding these metrics goes beyond simply watching numbers climb on your fitness watch. Different metrics tell different stories about your fitness: some reveal aerobic capacity, others show muscular strength adaptations, and still others indicate recovery status or injury risk. A runner obsessed solely with distance might miss critical warning signs about overtraining that elevated resting heart rate would reveal, or fail to notice improvements in efficiency that wouldn’t show up in their pace data alone.
Table of Contents
- What Are the Main Categories of Exercise Metrics?
- Heart Rate Metrics and Their Hidden Complexities
- Pace, Speed, and Distance Metrics in Practice
- Choosing Between Metric-Tracking Methods and Tools
- Avoiding Metric Misinterpretation and Training Errors
- Advanced Metrics That Reveal Deeper Fitness Truths
- The Future of Exercise Metrics and Holistic Training Data
- Conclusion
- Frequently Asked Questions
What Are the Main Categories of Exercise Metrics?
Exercise metrics fall into several distinct categories, each measuring different physiological systems. Time-based metrics include pace (time per distance) and duration, which are foundational for endurance sports. Distance-based metrics measure how far you travel, while power and intensity metrics—like watts on a bike or watts per kilogram for running—reflect the effort level. Physiological metrics encompass heart rate, breathing rate, blood oxygen saturation, and lactate levels, providing insight into what’s happening inside your body during exercise.
The relationship between these categories matters significantly. Two runners might complete the same 5-mile run in the same 40 minutes, but one could have an average heart rate of 155 bpm while the other averages 165 bpm—suggesting different fitness levels and effort distribution. This is why experienced coaches look at multiple metrics in combination rather than relying on any single number. A metric in isolation can mislead you, but patterns across metrics often reveal the complete picture of your fitness status.

Heart Rate Metrics and Their Hidden Complexities
Heart rate is often treated as the gold standard for measuring exercise intensity, but it’s far more complicated than most fitness trackers suggest. Your maximum heart rate, resting heart rate, and heart rate variability each provide distinct information, yet many people focus only on their performance within a single workout. Your maximum heart rate isn’t a fixed number—it can vary by 20 or more beats per minute depending on your fitness, the type of exercise, your hydration level, caffeine intake, sleep, and stress. Someone might achieve 188 beats per minute on a treadmill run but only 180 on a trail run, despite the trail run feeling harder.
A major limitation of heart rate tracking is that it lags behind actual exertion. When you suddenly accelerate, your heart rate takes 20-30 seconds to catch up, meaning real-time heart rate feedback doesn’t truly reflect your current effort level. Additionally, some individuals have naturally lower maximum heart rates, while others have higher resting heart rates due to anxiety rather than poor fitness. A trained athlete might have a resting heart rate of 45 bpm, while an unfit person might have 85 bpm—but comparing their exercise heart rates directly would be misleading without accounting for this baseline difference. Heart rate can also be elevated by illness, dehydration, or caffeine before it reflects actual fitness improvements, leading to false interpretations of your training.
Pace, Speed, and Distance Metrics in Practice
Pace and speed are among the most intuitive metrics for runners: pace is measured in minutes per mile or kilometers, while speed is simply the inverse (miles or kilometers per hour). Distance is straightforward—the total ground covered during your workout. These metrics have remained popular for decades because they’re easy to understand and compare across workouts. A runner who’s been training might improve from 10-minute miles to 8-minute miles over a year, making progress unmistakably visible.
However, distance and pace alone can mask problems or create false narratives. Someone might run farther each week and get faster but simultaneously increase their injury risk through overtraining. A runner crushing their distance and pace goals while ignoring heart rate variability and recovery metrics might be pushing into a state of accumulated fatigue that will eventually force a break from running. Environmental factors heavily influence pace: a headwind can slow you by 30-45 seconds per mile, hills add significant time, and running at altitude affects your speed compared to sea level. Two runners with identical fitness might have very different mile times depending on where they train, making it difficult to compare across different routes or seasons.

Choosing Between Metric-Tracking Methods and Tools
Different devices and methods capture metrics with varying accuracy. GPS watches typically have a margin of error of 5-10% for distance, smartphone GPS is often worse, while treadmills can vary significantly depending on calibration. Heart rate monitors worn on the wrist use optical sensors that struggle with motion artifact, while chest strap monitors are typically more accurate but less comfortable. Power meters for cyclists are expensive but provide incredibly precise data, whereas runners typically rely on pace estimates that can be influenced by how you hold your watch or the quality of satellite signal.
For most casual runners, a GPS watch with heart rate monitoring covers the essential metrics adequately, though understanding their limitations is important. A serious runner training for a marathon might benefit from a chest strap heart rate monitor for accuracy and a planned lactate threshold test to establish training zones. Someone doing strength training needs completely different metrics—tracking volume (sets × reps × weight) rather than pace. The tradeoff is that more precise measurement requires more sophisticated (and expensive) equipment, but for many runners, precision diminishes returns quickly after a certain point; a $300 sports watch will give you 90% of what a $1,500 device provides.
Avoiding Metric Misinterpretation and Training Errors
One of the most dangerous mistakes is ignoring recovery metrics entirely while obsessing over performance metrics. Your resting heart rate can increase 5-10 bpm when you’re fatigued, stressed, or getting sick—a clear warning sign that you need a lighter day—yet many runners miss this completely. Training with elevated resting heart rate significantly increases injury risk because your body hasn’t fully recovered from previous efforts.
Similarly, heart rate variability (the variation in time between heartbeats) actually increases with better fitness and drops when you’re overtraining or ill, but it’s completely invisible on most basic fitness trackers. Another common error is treating metrics as absolute rather than contextual. A pace that feels sustainable at sea level will be incredibly difficult at 10,000 feet elevation, yet your watch will show you’re running “slower.” A runner who’s been sick might have a higher average heart rate for the same pace for several days afterward, and pushing hard during this window will extend recovery. Blindly following target heart rates or pace benchmarks without accounting for temperature, terrain, sleep, nutrition, and life stress leads to injury or burnout for many people who blame themselves for “not being fit enough” when the real problem was metric mismanagement.
Advanced Metrics That Reveal Deeper Fitness Truths
VO2 max—the maximum amount of oxygen your body can utilize per kilogram of body weight per minute—is a powerful predictor of aerobic fitness and overall health, yet it’s often misunderstood. A runner with a VO2 max of 55 ml/kg/min is extremely fit, while someone with 35 ml/kg/min is moderately trained. Your VO2 max can increase 15-25% over several years of consistent aerobic training, and improvements in VO2 max correlate strongly with race performance. However, most fitness watches estimate VO2 max through proprietary algorithms based on heart rate data, and these estimates are often inaccurate—sometimes off by several points.
Training zones, calculated as percentages of your maximum heart rate, are used by serious runners to structure workouts with specific physiological adaptations. Zone 2 training (roughly 60-70% max heart rate) builds aerobic base and fat-burning capacity, Zone 3-4 (70-85%) improves tempo and threshold pace, while Zone 5 (85-100%) is high-intensity work for speed development. A runner who properly applies zone training might improve their marathon time by 5-10 minutes because they’re systematically developing specific energy systems rather than running every workout at similar moderate intensity. The limitation is that zone calculations depend on accurately knowing your maximum heart rate, and as mentioned earlier, this number is highly variable and often estimated incorrectly.
The Future of Exercise Metrics and Holistic Training Data
Exercise tracking is moving toward integration of more comprehensive data. Newer devices now combine heart rate variability, sleep quality, daily stress levels, and training load into holistic fitness scores that attempt to tell you whether you should rest or push hard on a given day. Some athletes are experimenting with continuous glucose monitoring to understand how different paces and intensities affect blood sugar, revealing individual metabolic responses to different training styles. Wearable technology is advancing toward measuring blood lactate levels and muscle oxygen saturation through the skin, providing data that previously required laboratory testing.
The next frontier is context-aware metrics that account for individual variation automatically. Rather than assuming you should train in specific heart rate zones, future devices might learn your personal physiology and adjust training recommendations based on how your body actually responds. Artificial intelligence models trained on population data can now predict injury risk from subtle changes in running gait and impact forces detected by sensor-equipped shoes. As this technology becomes more sophisticated, the emphasis will likely shift from raw numbers toward personalized interpretation and automated coaching that respects individual differences instead of forcing everyone into standardized frameworks.
Conclusion
Understanding exercise metrics requires recognizing that no single number tells the complete story of your fitness or performance. Each metric provides a unique window into different aspects of your body’s response to training—your cardiovascular system, aerobic capacity, muscular power, or recovery status. The most effective approach combines multiple metrics contextually, understanding their limitations and the individual factors that influence them, rather than chasing any single number.
A pace improvement means something different at sea level than at altitude; a heart rate elevation might indicate fitness gains or the onset of overtraining depending on what else has changed in your training and recovery. Start by tracking the basic metrics that matter most for your goals: runners should monitor pace and heart rate, cyclists should track power or speed, and strength athletes should measure volume and movement quality. Over time, add more sophisticated metrics as your knowledge deepens and your training becomes more specific. Most importantly, use metrics as tools for understanding your body’s responses and making informed decisions, not as rigid targets that override how you actually feel or ignore the bigger picture of your health and well-being.
Frequently Asked Questions
Why does my pace seem slower even though I feel more fit?
Heart rate efficiency often improves before pace does. Your heart rate might be lower at the same pace, indicating improved cardiovascular fitness, but speed gains typically lag behind these efficiency improvements. Additionally, environmental factors like wind, hills, and weather can slow your pace without indicating decreased fitness.
How accurate are wrist-worn heart rate monitors?
Optical wrist-worn heart rate monitors typically have a 5-15% margin of error, with accuracy varying significantly based on arm movement, skin tone, tattoos, and fit. Chest strap monitors are generally more accurate but can still drift. For training purposes, consistency matters more than absolute accuracy—if your device is reliably within its range, you can still use trends to guide training.
Should I train primarily by pace, heart rate, or power?
Each has advantages depending on your sport and goals. Pace is intuitive for runners but heavily influenced by terrain and environment. Heart rate reflects effort but lags behind actual exertion. Power is precise for cycling but requires expensive equipment. Most runners benefit from combining pace and heart rate for a complete picture.
What’s a good resting heart rate?
Resting heart rate varies by age and fitness level. Most adults fall between 60-100 bpm, athletes often range 40-60 bpm, and very elite endurance athletes can be below 40 bpm. The important metric is your individual baseline and how it changes—a 10 bpm increase in your personal resting heart rate suggests overtraining or illness regardless of the absolute number.
How can I estimate my maximum heart rate?
The formula 220 minus your age is a rough estimate but often inaccurate by 20+ bpm. A better approach is a field test: after thorough warm-up, run hard for 3-4 minutes, then do a 30-second all-out sprint and note your peak heart rate. Repeat this test several times on different days to account for variation from environmental conditions, stress, and fatigue.
Can I improve VO2 max, and how long does it take?
Yes, VO2 max improves through consistent aerobic training, particularly high-intensity interval work combined with long, slow distance runs. Improvements typically appear within 6-8 weeks of consistent training, with continued gains over months and years. Sedentary individuals can see 15-25% improvements, while already-trained athletes see smaller percentage gains but still meaningful performance improvements.